
If you’re curious about the world of data, you might have heard the job title “data analyst.” But what does a data analyst actually do? In this blog post, I’ll explain who data analysts are, what their daily tasks look like, and what tools they use. I’ll also talk about the skills you need to become one and the kinds of job opportunities you can find in this growing field. Whether you’re just starting out or thinking about a career change, this guide will help you understand the role and see if it’s the right fit for you.
Table of Contents
- What Is Data Analysis and Why Does It Matter?
- What Does a Data Analyst do?
- Are Data Analysts in Demand?
- Different Job Titles That Involve Data Analysis Tasks
- Must-Have Tools for Every Data Analyst
- Pros and Cons of Being a Data Analyst
What Is Data Analysis and Why Does It Matter?
In simple terms, data analysis is all about turning raw numbers into useful insights that help businesses make smarter decisions. It’s a big part of business intelligence, helping companies understand what’s really happening and what they should do next.
Imagine an online store noticing a drop in sales. A data analyst would dig into the numbers to find out why, maybe fewer people are visiting the website, or a popular product went out of stock. By analyzing this data, they can figure out the problem and help the team fix it. That’s what we mean by “actionable insights.”
The process includes collecting raw data from different sources, cleaning and organizing it so it makes sense, analyzing it to find patterns or trends, and finally, telling the story behind the numbers. This last step, the storytelling is key. It’s not just about charts and tables, but about explaining what the data means in a clear, simple way. For example, a data analyst at a hospital might present findings that help doctors reduce patient wait times, or one at a marketing agency might show which campaigns are bringing in the most customers.
Data analysis is used everywhere, from helping sports teams improve performance to guiding governments in making better public policies. It’s a skill set that’s becoming more and more valuable in today’s data-driven world.
What Does a Data Analyst Do?
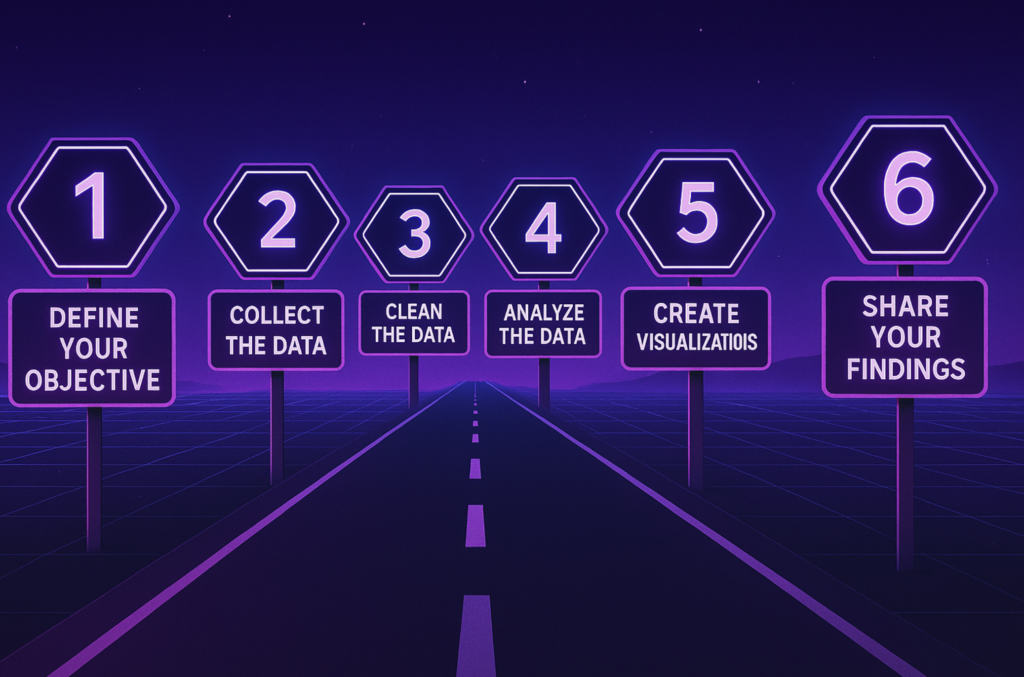
Step 1: Start with a Clear Question or Problem
Every data analysis project begins with a question. A data analyst doesn’t just start looking at numbers randomly. They need to know what they’re trying to find out. For example, a company might ask, “Why did our customer satisfaction score drop last quarter?” or “Which marketing channel brings the highest return on investment?” Defining the question helps focus the analysis and makes sure the data collected will be useful.
Step 2: Gather the Right Data
Once the goal is clear, the next step is collecting the data needed to answer the question. This could involve pulling data from internal databases (like sales records, customer feedback, or website traffic) or external sources (like market trends or public datasets). A retail analyst, for instance, might collect data from both in-store purchases and online transactions to get the full picture.
Step 3: Prepare and Clean the Data
Raw data is rarely perfect. It often contains missing values, duplicate records, or incorrect entries. A big part of a data analyst’s job is cleaning this data so it’s accurate and ready for analysis. This process can take time but is crucial, because bad data leads to bad decisions. For example, a small typo in a product ID might make it seem like there are more products sold than there actually were.
Step 4: Analyze the Data for Patterns and Insights
With clean data in hand, the analyst can start looking for patterns, trends, and answers. This might involve calculating averages, running statistical models, or comparing performance over time. A financial analyst might compare this year’s expenses to last year’s, or a marketing analyst might look at customer behavior to see which products are trending.
Step 5: Visualize the Results
Numbers alone can be hard to understand, so data analysts often turn their findings into visualizations like charts, graphs, and dashboards. These visuals make complex data easier to digest. For example, instead of showing a spreadsheet with 1,000 rows, a bar chart might quickly reveal which product category is performing best.
Step 6: Communicate Your Findings Clearly
Finally, a data analyst needs to explain what the data says in a way others can understand and use. This might be done through a report, presentation, or dashboard. Good analysts don’t just share results, they tell the story behind the data. For example, they might explain how customer behavior changed after a price increase and recommend a strategy to improve sales again.
Are Data Analysts in Demand?
Yes, data analysts are in high demand in both New Zealand (where I live) and Europe (where I came from), reflecting a global trend towards data-driven decision making across industries.
New Zealand:
- Data analysts are among the top three in-demand tech jobs in New Zealand for 2024 as we can see on Hays.
- There is a shortage of experienced data analysts in the country, with nearly two-thirds of IT employers reporting skills shortages.
- Salaries for data analysts in New Zealand range from NZD 80,000 to NZD 130,000 annually, averaging around NZD 100,000, reflecting the high demand for these skills.
Europe:
- The European data analytics market generated USD 17.58 billion in revenue in 2024 and is projected to grow at a compound annual growth rate (CAGR) of 25.9% from 2025 to 2030, you can check the data here.
- Major European technology centers are actively seeking professionals with data analyst skills, with a notable shortage of digital skills in areas like data analysis, AI, and machine learning.
- Cities such as London, Paris, and Berlin have the highest number of data job openings, particularly in the Business Services and IT sectors.
- In Germany, the median salary for a data analyst is €58,713, significantly higher than the national average salary of €41,125, indicating strong demand for these professionals.
- In Hungary over 1,000 data analyst job openings have been posted recently, and there are remote options as well. The average monthly salary for a data analyst is around HUF 800,000, with total compensation, including bonuses, estimated at HUF 858,750 per month.
Different Job Titles That Involve Data Analysis Tasks
When looking for a data analyst role, it’s important to know that many companies use different job titles that involve similar skills and responsibilities. While job ads might use different titles, the key is to look at the skills and tools mentioned, if you see terms like SQL, Excel, dashboards, KPIs, insights, or data-driven decisions, chances are it’s a data analyst-type role.

Here are some common alternative job titles that often include data analysis work:
Healthcare Data Analyst
- Works in hospitals, insurance companies, or public health institutions
- Analyzes patient records, treatment outcomes, and hospital operations
- Helps improve patient care, reduce costs, and support policy decisions
Business Analyst / Business Data Analyst
- Focuses on understanding business needs and finding data-driven solutions
- Bridges the gap between data teams and management
- Often works on improving internal processes or product strategies
- May use data to build business cases, forecasts, or performance reports
Reporting Analyst / Data Reporting Specialist
- Specializes in creating regular reports and dashboards
- Uses tools like Excel, Power BI, or Tableau
- Ensures stakeholders have up-to-date information to make decisions
Analytics Consultant
- Often works for consulting firms or as a freelancer
- Helps clients identify problems, analyze data, and implement solutions
- Needs strong communication skills to present insights clearly
Marketing or Sales Data Analyst
- Focuses on campaign performance, customer behavior, and ROI
- Helps businesses understand which marketing strategies work
- Works with CRM tools, Google Analytics, and social media platforms
Operations or Supply Chain Analyst
- Uses data to improve logistics, inventory, and production
- Helps companies reduce costs and improve efficiency
- Often works with large data sets and forecasting models
Financial/Data Risk Analyst
- Common in banks, insurance, and fintech
- Focuses on risk models, fraud detection, and compliance
- Strong skills in statistics, Excel, SQL, or even Python/R are useful
Product Analyst
- Works closely with product managers, developers, UX Researchers
- Analyzes user behavior and feature performance
- Helps make product decisions based on data insights
Must-Have Tools for Every Data Analyst

Data Analysis & Manipulation Tools for Data Analysts
Tools like Excel, SQL, and Python are core to data analysis.
- Excel is perfect for quick summaries, pivot tables, and simple visualizations. It’s often used in the early stages of analysis or when working with small datasets.
- SQL is used to extract data from databases. It allows analysts to filter, join, and sort large datasets using clear and structured queries.
- Python (especially with
pandasandNumPy) lets you perform advanced data manipulation, automate tasks, and scale your analysis. - R is another option, especially useful for statistical analysis and working in research or academic environments.
Data Visualization Tools
Visuals make data easier to understand. These tools help you turn raw data into clear insights:
- Tableau is known for beautiful, interactive dashboards and easy drag-and-drop features.
- Power BI works well in business environments, especially with Microsoft integrations.
- Looker Studio (formerly Google Data Studio) is great for creating free, shareable dashboards using Google data sources.
- For Python users, libraries like Matplotlib, Seaborn, or Plotly allow for custom and detailed chart creation.
Database Management Tools
Knowing how to access and query data stored in databases is key:
- MySQL, PostgreSQL, and SQL Server are common relational databases. SQL is used to interact with them directly.
- BigQuery, Snowflake, and Amazon Redshift are cloud-based databases used for working with very large datasets (often called “big data”).
Data Preparation & ETL Tools
Before you can analyze data, you often need to clean and transform it:
- Alteryx offers an easy, no-code interface for preparing and blending data quickly.
- Apache Airflow is used to schedule and manage data pipelines in production environments.
- Talend and KNIME are open-source tools that let you build data workflows visually and automate complex tasks.
Reporting & Collaboration Tools for Data Analysts
Once your analysis is ready, you need to share it:
- Google Sheets and Excel Online allow for collaborative, cloud-based reporting.
- Notion or Confluence are great for documenting insights and analysis steps, especially within teams.
- Jupyter Notebooks are perfect for combining live code, visual output, and explanations in one place—great for presenting analysis or training others.
Bonus Tools That Add Value
These aren’t required, but they boost your effectiveness:
- Git / GitHub let you track changes in your scripts and collaborate with others.
- APIs are useful if you need to pull in external data, like weather info, financial market data, or social media stats.
- AI tools like ChatGPT can assist with writing SQL queries, debugging Python code, or explaining technical concepts in plain English.
Pros and Cons of Being a Data Analyst
Being a data analyst comes with many advantages. It’s a high-demand job with strong earning potential and clear career growth. Analysts work in various industries, like finance, healthcare, marketing, and tech, so you can choose a field that interests you. The job is intellectually rewarding, especially when your insights lead to real business improvements. Plus, many roles offer flexibility, including remote or hybrid work options.
However, there are also challenges. The work can be repetitive, especially when cleaning messy data or producing routine reports. Tight deadlines and unclear stakeholder requests can also be frustrating. Sometimes, analysts are expected to “just find insights” without enough context. And while tools help, learning and keeping up with new technologies (like Python or BI tools) requires ongoing effort.
Overall, if you enjoy solving problems with data and don’t mind the challenges, it’s a great career choice.