
If you want to become a data analyst, Python is one of the best tools to learn. It’s flexible, beginner-friendly, and used by professionals every day. In this post, I’ll share the tools and libraries that helped me the most when I started learning Python for data analysis. I’ll also give you a few tips that helped me on my journey. I’m still learning too, it will never end, but if you’re just getting started, this guide will help you feel more confident and excited about using Python.
Table of Content
- Setting Up Your Python Environment
- Essential Python Libraries for Data Analysts
- Working with Excel and Databases
- Visualising Your Data
- Useful Python Skills to Learn Next
- Sharing Your Work
- AI-Related Python Libraries
Setting Up Your Python Environment
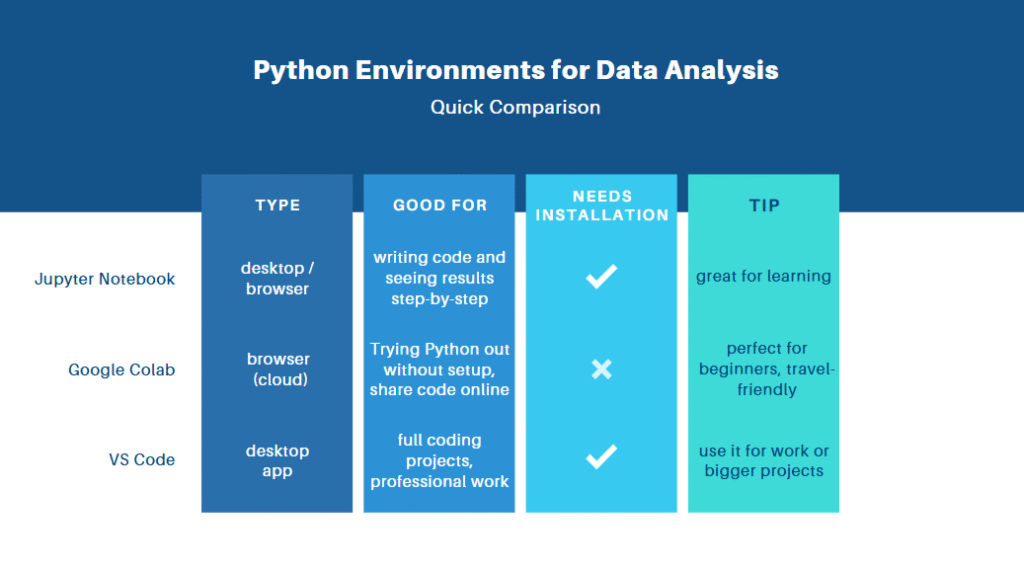
Before you can start analysing data with Python, you need to set up your environment. Don’t worry, it’s easier than it sounds! Think of this as preparing your digital workspace. The best part? You don’t need a fancy computer or expensive software. I started with just my laptop and a cup of tea. You’ll learn about tools like Jupyter Notebook or Google Colab, which let you write and test code without needing to install anything complicated.
Jupyter Notebook
This is one of the most popular tools for data analysts. It lets you write code, run it, and see the results immediately—all in one place. You can also add text, images, and charts to explain your work. It’s perfect for beginners because it’s visual and easy to use. I started with this, and I still use it today for quick experiments. You can install it using Anaconda, or run it inside VS Code.
Google Colab
Colab is just like Jupyter Notebook—but in the cloud! You don’t have to install anything. You only need a Google account. It runs in your browser and even gives you free access to some powerful computing (great if your laptop isn’t very fast). It’s super useful when I want to share code or work from different devices.
VS Code
VS Code is a code editor, not just for Python, but for many programming languages. It’s great when your projects get a bit bigger and more complex. You can also run Jupyter notebooks inside it, so it’s like having everything in one place. I use Jupyter or Colab to explore data, and VS Code when I’m working on full projects.
Essential Python Libraries for Data Analysts
When you start working with data, you’ll quickly realise that Python on its own is just the beginning. The real magic happens with libraries, collections of pre-written code that help you do specific tasks. These libraries save you time and make your work much easier. I introduce the most important Python libraries that every data analyst should know. Don’t worry if they sound a bit strange at first, just read about them and try them out!
Pandas
Pandas helps you work with data in tables like Excel, but way more powerful. You can clean data, sort it, filter it, and group it, and all with a few lines of code. I really like it. It’s the first tool I go to when I start any data project.
import pandas as pd

df = pd.read_csv("sales.csv")
print(df.head())
NumPy
NumPy is great for working with numbers and arrays, that are big lists of numbers, it’s good with numerical operations and matrix math. It’s very fast and is the foundation for many other tools. It helps do calculations and work with data behind the scenes.
import numpy as np

numbers = np.array([10, 20, 30])
print(np.mean(numbers))
Matplotlib
Matplotlib lets you create simple charts like bar plots, line graphs, and histograms. It’s not the prettiest, but it’s reliable and gives you control. It is just for low-level plotting, nothing else. It’s perfect for quick visuals when I want to understand trends, but I don’ t use it for presentations, not pretty enough.
import matplotlib.pyplot as plt

plt.plot([1, 2, 3], [10, 20, 15])
plt.title("My First Line Chart")
plt.show()
Seaborn
Seaborn is built on top of Matplotlib and makes your graphs look amazing with less effort. It’s great for statistics and comparisons. It saves time and looks great for reports or blog posts (I will use it in my blog in the near future).
import seaborn as sns

sns.histplot(data=df, x="price")
Working with Excel and Databases
As a data analyst, you’ll often get your data from Excel files or databases. The good news? Python makes it really easy to connect to both! Whether you’re analysing monthly sales in an Excel sheet or pulling thousands of records from a database, you can do it all in a few lines of code. Let’s look at the two most common sources of data: Excel files and SQL databases.
Excel
The most popular way to read Excel files in Python is with Pandas. Behind the scenes, it uses a tool called openpyxl to work with .xlsx files. You can clean, update, and export Excel data all from Python, no need to open Excel!
import pandas as pd

# Read an Excel file
df = pd.read_excel("monthly_sales.xlsx")

# Save changes to a new file
df.to_excel("updated_sales.xlsx", index=False)
Connecting to a Database
If your company, or you in a hobby project use a database like MySQL, PostgreSQL, or SQLite, you can use Python to query the data using SQL. You can combine the power of SQL and Python to filter, analyse, and visualise large datasets easily.
import sqlite3
import pandas as pd

# Connect to a local SQLite database
conn = sqlite3.connect("customer_data.db")

# Run an SQL query and get the results in a DataFrame
df = pd.read_sql("SELECT * FROM customers", conn)
Visualising Your Data
Data isn’t just about numbers, it’s about stories. I read this line a million times all over the internet, when I learned how to be a data analyst. You know what? It is TRUE! You are (or going to be) a storyteller!
One of the best ways to tell those stories is with visuals. Charts and graphs help you and others see patterns, trends, and insights more clearly. In Python, two of the best tools for this are Matplotlib and Seaborn.
When I started learning Python, I didn’t use visuals at first. Big mistake! Once I began plotting charts, I could understand the data so much faster. Visuals can help you spot errors, find the outliers qucikly, compare groups, or just explain your results in a more powerful way.
With just a few lines of code, you can build:
- Line charts – great for trends over time (e.g. sales per month)
- Bar plots – compare categories (e.g. revenue by product)
- Histograms – see the shape of your data (e.g. age of users)
- Scatter plots – spot relationships between variables (e.g. hours vs. grades)
- Box plots – check for outliers or group differences (e.g. exam scores by gender)
- Pie chart – show parts of a whole (e.g. market share)

A Quick Example with Seaborn
This code creates a beautiful bar chart in just a few seconds, try this out!
import seaborn as sns
import pandas as pd

# Sample data
df = pd.DataFrame({
    "category": ["A", "B", "C"],
    "sales": [100, 200, 150]
})

# Plotting
sns.barplot(data=df, x="category", y="sales")
Useful Python Skills to Learn Next
Once you’re comfortable with the basics, it’s a good idea to explore some more advanced Python skills that can make your work faster. One of the first things to learn is data cleaning techniques using Pandas, such as
- handling missing values,
- filtering data, and
- changing data types.
Another helpful skill is writing functions to organise your code better and avoid repeating yourself. As your projects grow, learning about loops and conditional statements will help you build more flexible scripts. It’s also useful to get familiar with list comprehensions, which let you write shorter and more efficient code.
Finally, understanding file handling, like reading from and writing to text or CSV files, is a must-have skill for any data analyst. These tools will help you manage real-world data with more confidence.
What is SQLAlchemy?
SQLAlchemy is a powerful Python library that helps you work with databases more easily. Instead of writing long SQL queries by hand, you can use SQLAlchemy to interact with your database using Python code. It works like a bridge between your Python program and the database. SQLAlchemy supports many database systems, such as MySQL, PostgreSQL, and SQLite. One of its best features is the Object Relational Mapper (ORM), which lets you work with tables as if they were Python classes. This makes your code cleaner, safer, and easier to understand. If you’re working on a bigger data project or want to connect Python to a database efficiently, SQLAlchemy is a great tool to learn.
Using Requests to Call APIs and Get External Data
The requests library in Python is a simple and popular tool for getting data from the internet. You can use it to call APIs, which are services that provide data from other websites, like weather updates, stock prices, or news headlines. To use it, you just need to import the library and send a GET request to the API’s URL. The server will respond with data, usually in JSON format, which you can then read and use in your project. For example, if you want to get the weather for your city, you can call a weather API, receive the temperature and forecast, and show it in your analysis. It’s a great way to make your data projects more dynamic and real-time.
Sharing Your Work
Sharing your work is an important part of being a data analyst. Once you finish your analysis, there are many ways to present your results to others. You can create dashboards using tools like Tableau or Power BI, which are interactive and easy for non-technical people to understand. You can also use Jupyter Notebooks to show your code, charts, and explanations all in one place. If you prefer written reports, you can export your findings into a PDF or Word document. For quick sharing and collaboration, many analysts use Google Colab or GitHub, where others can see your code and give feedback. The key is to choose a format that fits your audience and makes your insights clear and easy to understand.
AI-Related Python Libraries
As you go deeper into data analysis, you might want to explore machine learning and advanced statistics. Python has several great libraries that help with this.
Scikit-learn is one of the most popular tools for machine learning. It allows you to build models for classification, regression, and clustering with just a few lines of code.
SciPy is useful for scientific and mathematical tasks like optimization, integration, or solving equations. It’s a powerful tool when you need more advanced calculations.
Statsmodels is perfect for statistical analysis. It helps you run tests, build linear models, and understand relationships between variables.
These libraries are very helpful when you want to move from simple analysis to more complex, AI-driven projects.