
Mastering Business Metrics: The Key to Business Growth
Running a small or medium-sized business can feel like a rollercoaster. One month, sales are booming, and the next, you’re wondering where all the money went. As an entrepreneur I have learnt a lot about these metrics, they have a direct impact on your business and can help you understand the actions that have taken place. That’s why understanding business metrics and KPIs (Key Performance Indicators) is so important. They help you track performance, spot problems early, and make smarter decisions.
When I first started learning about business analytics, I felt overwhelmed by all the numbers. But once I broke them down, I realized that these metrics are like a business health check-up. Just like a doctor looks at your heart rate and blood pressure, business owners and analysts should look at revenue, profit margins, customer retention, and other key numbers to understand what’s working and what needs improvement.
In this post, I’ll walk you through the key business metrics that even small and medium-sized businesses should be tracking. I’ll explain what they mean, why they matter, and how you can calculate them. Plus, I’ll share real-life examples to make things easier to understand. Whether you’re new to business data analysis, business analytics or just want a simple guide, this post will help you make data-driven decisions with confidence. Let’s dive in!
The most important business metrics
- Revenue
- Gross Profit Margin (GPM)
- Net Profit Margin
- Customer Acquisition Cost (CAC)
- Customer Lifetime Value (CLV)
- Churn Rate
- Inventory Turnover Ratio
- Return on Investment (ROI)
- Accounts Receivable Turnover
- Employee Productivity (Revenue per Employee)
- Final Thoughts
1. Revenue – How Much Money The Business Brings In
The first business metrics is revenue. This is the total amount of money a business earns from selling its products or services. It’s the starting point of any financial analysis because, without revenue, there’s no business to run. Tracking revenue helps business owners understand their sales performance, identify trends, and make informed decisions about pricing, marketing, and growth strategies.
In simple terms, revenue shows how much money is coming in before expenses are deducted. But high revenue doesn’t always mean high profit, so it’s important to analyze it alongside other financial metrics. Let’s break down how to calculate revenue and look at some real-world examples.
Notes to learn
Definition: Total income generated from sales before any expenses.
Importance: Measures overall business performance and growth.
Formula: Revenue = Units Sold × Price per Unit
Examples
1. Retail Business Metrics Example – Fashion Boutique
Imagine a small fashion boutique that sells trendy, high-quality t-shirts. The store operates both online and in a physical shop, targeting young professionals and fashion-conscious shoppers. In a given month:
- The boutique sells 1,000 shirts
- Each shirt costs $20
- Their total revenue for the month is: 1,000 × 20 = 20,000
So, the boutique generated $20,000 in revenue before considering costs like inventory, rent, and marketing.
2. SaaS Business Example – Online Project Management Tool
Now, consider a small Software-as-a-Service (SaaS) company that provides an online project management tool for freelancers and small teams. They operate on a monthly subscription model where users pay to access their software. In a given month:
- They have 50 active subscribers
- Each subscriber pays $100 per month
- Their total revenue for the month is 50 × 100 = 5,000
This means the SaaS company generated $5,000 in revenue for that month. Since their costs mostly include software maintenance, customer support, and marketing, they likely have high profit margins.
Both businesses generate revenue differently. One through product sales, the other through subscriptions, but both need to track revenue carefully to understand business performance and plan for growth.

2. Gross Profit Margin – How Much Profit The Business Keeps from Sales
Gross Profit Margin (GPM) is one of the most important business metrics that shows how much money a business keeps after covering the direct costs of selling its products or services. It’s a key indicator of profitability because it tells you how efficiently you are producing and selling your goods. A higher GPM means a business is keeping more profit from each sale, while a lower GPM may indicate high production costs or pricing issues.
In simple terms, GPM helps you see how much of your revenue actually turns into profit before deducting other expenses like rent, marketing, and salaries. Understanding this metric allows businesses to set better pricing, reduce costs, and improve overall profitability. Let’s break down how to calculate it and look at some real-world examples!
Notes to learn
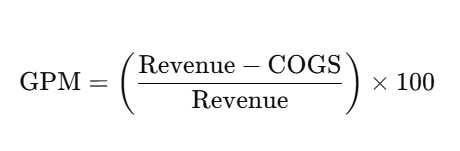
Definition: The percentage of revenue left after subtracting the cost of goods sold (COGS).
Importance: Indicates profitability before other expenses.
Formula:
Examples
1. Retail Business Metrics Example – Fashion Boutique
Let’s go back to our small fashion boutique that sells trendy, high-quality t-shirts. We already know that:
- The boutique sells 1,000 shirts
- Each shirt costs $20, so their total revenue is $20,000
Now, let’s consider the cost of goods sold (COGS). This includes the cost of materials, manufacturing, and shipping:
- The boutique spends $8 per shirt on production
- Total COGS = 1,000 × 8 = $8,000
Now, let’s calculate the Gross Profit Margin: GPM = ((20,000 − 8,000) / 20,000) x 100 = 60
So, the boutique keeps 60% of its revenue as gross profit before covering other expenses like rent, salaries, and marketing.
2. SaaS Business Example – Online Project Management Tool
Now, let’s look at our SaaS company that provides an online project management tool. They operate on a subscription model where:
- They have 50 active subscribers
- Each subscriber pays $100 per month
- Their total revenue for the month is $5,000
Since SaaS businesses don’t have physical products, their COGS mainly includes software development, hosting, and customer support costs:
- Their COGS for the month is $500
Now, let’s calculate the Gross Profit Margin: GPM = ((5,000 − 500) / 5,000) × 100 = 90
This means the SaaS company keeps 90% of its revenue as gross profit, making it much more profitable than a retail business in terms of margins.

3. Net Profit Margin – How Much Profit The Business Actually Keeps
Net Profit Margin (NPM) shows how much of your revenue turns into actual profit after all expenses are deducted. While Gross Profit Margin focuses only on the cost of producing goods, Net Profit Margin takes everything into account—rent, salaries, marketing, taxes, and other operational costs. This makes it one of the best indicators of a company’s overall profitability and financial health.
In simple terms, NPM helps you see what percentage of your revenue stays in your pocket after paying all the bills. A high Net Profit Margin means a business is running efficiently, while a low margin could indicate high costs or pricing issues. Let’s break down how to calculate it and look at some real-world examples.
Notes to learn
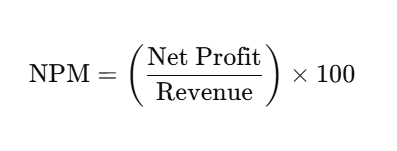
Definition: The percentage of revenue left after deducting all expenses.
Importance: Shows overall profitability and business efficiency.
Formula:
Examples
1. Retail Business Metrics Example – Fashion Boutique
Let’s go back to our small fashion boutique that sells trendy, high-quality t-shirts. We already know that:
- The boutique sells 1,000 shirts
- Each shirt costs $20, so their total revenue is $20,000
- The cost of goods sold (COGS) is $8,000
Now, let’s consider other expenses like rent, employee salaries, marketing, and taxes:
- Total operating expenses = $7,000
- Net Profit = Revenue – COGS – Operating Expenses = 20,000 − 8,000 − 7,000 = 5,000
Now, let’s calculate the Net Profit Margin: NPM = (5,000 / 20,000) × 100 = 25
So, after all expenses, the boutique keeps 25% of its revenue as profit.
2. SaaS Business Example – Online Project Management Tool
Now, let’s look at our SaaS company that provides an online project management tool. They operate on a subscription model where:
- They have 50 active subscribers
- Each subscriber pays $100 per month
- Their total revenue for the month is $5,000
- Their cost of goods sold (COGS) is $500
Now, let’s consider other expenses like customer support, marketing, software maintenance, and taxes:
- Total operating expenses = $1,000
- Net Profit = Revenue – COGS – Operating Expenses 5,000 − 500 − 1,000 = 3,500
Now, let’s calculate the Net Profit Margin: NPM = (3,500 / 5,000) × 100 = 70
This means the SaaS company keeps 70% of its revenue as profit, which is much higher than the retail business because software businesses have lower operational costs.
By tracking Net Profit Margin, businesses can see how efficiently they convert sales into real profit and find ways to improve their bottom line.
4. Customer Acquisition Cost – How Much to Spend to Gain a Customer
Customer Acquisition Cost (CAC) tells you how much money a business spends to attract a new customer. This includes marketing, advertising, and sales efforts. Understanding CAC is crucial because it helps businesses measure the efficiency of their marketing strategies. A low CAC means a business is getting customers cheaply, while a high CAC could indicate inefficient marketing or tough competition.
In simple terms, CAC shows how much it costs to convince someone to buy from you. If a business spends too much on acquiring customers without making enough revenue from them, it can struggle to stay profitable. Let’s break down how to calculate it and look at our real-world examples!
Notes to learn
Definition: The cost of acquiring a new customer.
Importance: Helps assess marketing efficiency and profitability.
Formula: Customer Acquisition Cost (CAC) = (Total Sales and Marketing Expenses) / (Number of New Customers Acquired)
Examples
1. Retail Business Metrics Example – Fashion Boutique
Let’s go back to our small fashion boutique that sells trendy t-shirts. To attract new customers, they invest in social media ads, influencer collaborations, and seasonal discounts. In a given month:
- The boutique spends $2,000 on marketing campaigns
- These efforts bring in 200 new customers
Now, let’s calculate the Customer Acquisition Cost: CAC = 2,000 / 200 = 10
So, the boutique spends $10 to acquire each new customer. If their average customer spends much more than that, this is a good investment.
2. SaaS Business Example – Online Project Management Tool
Now, let’s look at our SaaS company, which provides an online project management tool. They use paid online ads, content marketing, and email campaigns to attract new users. In a given month:
- They spend $5,000 on marketing and advertising
- These efforts bring in 50 new paying subscribers
Now, let’s calculate the Customer Acquisition Cost: CAC = 5,000 / 50 = 100
This means the SaaS company spends $100 to acquire each new customer. Since SaaS businesses usually make revenue over time through monthly subscriptions, their CAC must be lower than their Customer Lifetime Value (CLV) to stay profitable. I will tell you more about CLV in the next chapter of this blog.
Tracking CAC helps businesses ensure they aren’t overspending on marketing and that their investment in new customers actually pays off.

5. Customer Lifetime Value – How Much a Customer is Worth Over Time
Customer Lifetime Value (CLV) tells you how much total revenue a business can expect to earn from a single customer over their entire relationship with the company. This metric is important because it helps businesses understand how valuable their customers are in the long run. A high CLV means customers keep coming back and spending more, while a low CLV may indicate poor retention or low repeat purchases.
In simple terms, CLV shows how much money a customer brings to your business over time, not just from one purchase. By increasing CLV, businesses can grow profits without constantly spending more on acquiring new customers. Let’s break down how to calculate it and look at our real-world examples again!
Notes to learn
Definition: The total revenue a business expects to earn from a customer during their entire relationship.
Importance: Helps businesses understand long-term profitability and retention.
Formula: CLV = Average Purchase Value x Purchase Frequency × Customer Lifespan
Examples
1. Retail Business Metrics Example – Fashion Boutique
Let’s go back to our small fashion boutique that sells trendy t-shirts. The boutique has many repeat customers who shop multiple times a year. On average:
- Customers spend $50 per visit
- They shop 5 times per year
- They remain customers for 3 years
Now, let’s calculate the Customer Lifetime Value: CLV = 50 x 5 x 3 = 750
So, the boutique earns $750 per customer over 3 years. This means keeping existing customers happy and encouraging repeat purchases is just as important as acquiring new ones.
2. SaaS Business Example – Online Project Management Tool
Now, let’s look at our SaaS company, which provides an online project management tool. Since it runs on a subscription model, its revenue comes from monthly payments. On average:
- Customers pay $100 per month
- They stay subscribed for 5 years
Now, let’s calculate the Customer Lifetime Value: CLV = 100 × 12 × 5 = 6,000
This means the SaaS company earns $6,000 per customer over 5 years. Since SaaS businesses often have high marketing costs, ensuring a high CLV is crucial for long-term success.
By tracking CLV, businesses can see how much they should spend on customer retention and marketing while making sure their long-term revenue stays strong.

6. Churn Rate – How Many Customers The Company Loses Over Time
Churn Rate measures the percentage of customers who stop doing business with you over a given period. This is especially important for businesses that rely on repeat customers or subscriptions, as a high churn rate can hurt long-term revenue. If too many customers leave, a business must spend more on acquiring new ones, which can reduce profitability.
In simple terms, Churn Rate shows how well a business keeps its customers coming back. A lower churn rate means customers stay loyal, while a higher churn rate may signal issues with pricing, product quality, or customer service.
Notes to learn
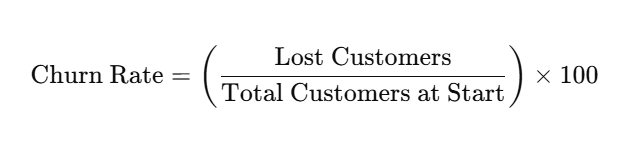
Definition: The percentage of customers lost over a period.
Importance: Indicates customer retention and business stability.
Formula:
Examples
1. Retail Business Metrics Example – Fashion Boutique
Our fashion boutique has a steady stream of customers, but not everyone comes back to shop again. In a given month:
- The boutique starts with 1,000 customers
- 50 customers don’t return
Now, let’s calculate the Churn Rate: ChurnRate = (50 / 1,000) x 100 = 5
This means the boutique loses 5% of its customers each month. Keeping this number low is crucial for long-term success, so the boutique might offer loyalty programs or promotions to encourage repeat purchases.
2. SaaS Business Example – Online Project Management Tool
For a SaaS business, churn is even more important because it operates on a subscription model. If too many customers cancel, revenue drops. In a given month:
- The company starts with 100 subscribers
- 10 customers cancel their subscriptions
Now, let’s calculate the Churn Rate: ChurnRate = (10 / 100) × 100 = 10
This means the SaaS company loses 10% of its customers each month. To reduce churn, they might improve customer support, add new features, or offer discounts for long-term subscriptions.
By tracking Churn Rate, businesses can find ways to improve customer retention, which is often cheaper and more effective than constantly finding new customers.

7. Inventory Turnover Ratio – How Fast The Company Sells Its Stock
Inventory Turnover Ratio measures how often a business sells and replaces its inventory over a period. It’s a key metric for retail and product-based businesses because it shows how efficiently a company manages stock. A high turnover means products are selling quickly, while a low turnover could indicate overstocking or slow sales.
In simple terms, this metric tells you how fast your products move off the shelves. Keeping the right balance is crucial—too much inventory ties up cash, while too little can lead to lost sales. Let’s break down how to calculate it and look at the real-world business examples.
Notes to learn
Definition: Measures how many times a business sells and replaces its inventory within a given period.
Importance: Helps manage stock levels, cash flow, and sales efficiency.
Formula: Inventory Turnover = COGS / Average Inventory
Examples
1. Retail Business Metrics Example – Fashion Boutique
Our fashion boutique sells trendy t-shirts and needs to keep inventory moving to stay profitable. Over a given month:
- Their cost of goods sold (COGS) is $8,000
- Their average inventory value is $2,000
Now, let’s calculate the Inventory Turnover Ratio: Turnover = 8,000 / 2,000 = 4
This means the boutique sells and replaces its entire inventory 4 times per month. A good turnover rate keeps products fresh and prevents unsold stock from piling up.
2. SaaS Business Example – Online Project Management Tool
For a SaaS company, inventory turnover doesn’t apply in the traditional sense since they sell digital products. However, if they offer software licenses or hardware, they might track this metric to manage supply.

8. Return on Investment – How Much The Company Earns From What It Spends
Return on Investment (ROI) measures how much profit a business makes compared to the money it invests. It’s one of the most important financial metrics because it helps businesses evaluate whether their spending—on marketing, new products, or equipment—is actually generating returns. A high ROI means the investment was worth it, while a low ROI may indicate that money was not well spent.
In simple terms, ROI tells you whether an investment is making or losing money. Businesses use it to decide where to put their resources and to ensure their money is working efficiently. Let’s break down how to calculate it and look at some real-world examples.
Notes to learn
Definition: Measures the profitability of an investment compared to its cost.
Importance: Helps businesses make smart financial decisions.
Formula:
ROI = ((Net Profit from Investment – Investment Cost) / Investment Cost ) x 100
Examples
1. Retail Business Metrics Example – Fashion Boutique
Our fashion boutique wants to increase sales, so they invest in a new advertising campaign to attract customers. In a given month:
- They spend $5,000 on ads
- The campaign brings in $10,000 in additional revenue
- After deducting product costs and other expenses, the net profit from this investment is $5,000
Now, let’s calculate the ROI: ROI = (5,000 / 5,000) x 100 = 100
This means the boutique doubled its investment (100%), making the ad campaign a great decision.
2. SaaS Business Example – Online Project Management Tool
The SaaS company decides to develop a new feature for their software, hoping to attract more customers. In a given quarter:
- They invest $20,000 in development costs
- The feature brings in $50,000 in new revenue
- After covering additional costs, the net profit from this investment is $30,000
Now, let’s calculate the ROI: ROI = (30,000 / 20,000) x 100 = 150
This means the SaaS company earned 150% more than what they invested, making the feature launch highly successful.
By tracking ROI, businesses can make better decisions about where to invest their money and focus on strategies that generate the highest returns.

9. Accounts Receivable Turnover – How Fast The Company Collects Payments
Accounts Receivable Turnover measures how efficiently a business collects payments from customers who buy on credit. It’s an important metric because the faster a business collects money owed, the better its cash flow. A high turnover means customers pay quickly, while a low turnover may indicate delayed payments or poor credit policies.
In simple terms, this metric shows how often a company converts its outstanding invoices into cash. Businesses that rely on credit sales need to keep track of this number to ensure they don’t run into cash flow problems. Let’s break down how to calculate it and look at some real-world examples.
Notes to learn
Definition: Measures how quickly a business collects outstanding payments from customers.
Importance: Helps businesses manage cash flow and credit policies.
Formula: Receivable Turnover = Net Credit Sales / Average Accounts Receivable
Examples
1. Retail Business Metrics Example – Fashion Boutique
Our fashion boutique mostly sells products in-store, but they also allow some loyal customers and bulk buyers to purchase on credit. Over a given period:
- Their net credit sales total $15,000
- Their average accounts receivable (the unpaid invoices) is $5,000
Now, let’s calculate the Accounts Receivable Turnover: Turnover = 15,000 / 5,000 = 3
This means the boutique collects its receivables 3 times per period, indicating a healthy credit collection process. If this number were lower, the boutique might need to tighten its credit terms to speed up payments.
2. SaaS Business Example – Online Project Management Tool
For a SaaS company, many customers pay upfront for subscriptions, but some corporate clients request invoicing and pay later. Over a given period:
- Their net credit sales total $20,000
- Their average accounts receivable is $4,000
Now, let’s calculate the Accounts Receivable Turnover:
Turnover = 20,000 / 4,000 = 5
This means the SaaS company collects payments 5 times per period, which is a strong indicator of efficient credit management.
By tracking Accounts Receivable Turnover, businesses can improve cash flow, reduce late payments, and ensure they get paid on time.

10. Employee Productivity – How Much Revenue Each Employee Generates
Employee Productivity, often measured as Revenue per Employee, helps businesses understand how efficiently their team contributes to overall revenue. A high revenue per employee means the business is running efficiently, while a low revenue per employee might indicate overstaffing, low sales, or inefficiencies in operations.
In simple terms, this metric shows how much money each employee brings to the business. It’s especially useful for comparing businesses of different sizes and finding ways to improve productivity. Let’s break down how to calculate it!
Notes to learn
Definition: Measures how much revenue each employee generates for the business.
Importance: Helps assess workforce efficiency and business profitability.
Formula: Receivable Turnover = Net Credit Sales / Average Accounts Receivable
Examples
1. Retail Business Metrics Example – Fashion Boutique
Our fashion boutique has a small but dedicated team. Over a given year:
- Their total revenue is $200,000
- They employ 10 staff members
Now, let’s calculate the Revenue per Employee: Revenue per Employee = 200,000 / 10 = 20,000
This means each employee generates $20,000 in revenue per year. If this number is low, the boutique might need to increase sales or optimize staffing levels.
2. SaaS Business Metrics Example – Online Project Management Tool
For a SaaS company, productivity is usually higher because software businesses rely less on manual labor. Over a given year:
- Their total revenue is $500,000
- They employ 5 team members
Now, let’s calculate the Revenue per Employee: Revenue per Employee = 500,000 / 5 = 100,000
This means each employee generates $100,000 in revenue per year, which is significantly higher than the boutique due to the scalability of digital products.
By tracking Revenue per Employee, businesses can find ways to increase efficiency, streamline operations, and improve profitability.

Individual Employee Productivity – The Performance Indicators
Employee productivity is not always the same for every employee, as different employees contribute differently based on their role, experience, and efficiency. The Revenue per Employee metric gives a general overview of team productivity, but businesses often go deeper by measuring individual productivity using different performance indicators.
How to Measure Individual Employee Productivity?
In addition to calculating Revenue per Employee at a company level, businesses often track specific employee performance metrics depending on their roles. Here are a few ways they measure individual productivity:
- Sales Teams: Measured by sales per employee, number of deals closed, or revenue generated individually.
- Customer Support Teams: Measured by number of tickets resolved, customer satisfaction scores, or response time.
- Software Developers: Measured by features delivered, code quality, or issue resolution speed rather than direct revenue.
- Retail Employees: Measured by number of items sold, transaction speed, or customer feedback rather than overall store revenue.
Example of Individual Employee Productivity in a Retail Business
Let’s say our fashion boutique has 10 employees, but they don’t all contribute equally. If one salesperson is exceptional and sells $50,000 worth of products per year, while another sells only $10,000, their productivity levels are very different.
To track this, the boutique might measure:
- Sales per Employee – How much revenue each employee generates individually.
- Customer Transactions per Employee – The number of customers each employee serves.
- Conversion Rate per Employee – How often a customer actually makes a purchase after interacting with a specific employee.
Example of Individual Employee Productivity in a SaaS Business
In a SaaS company, one marketer might generate 300 new leads per month, while another generates only 50 leads. Even though both contribute to revenue, their productivity levels differ.
The company might track:
- New Customers Acquired per Employee – How many users each salesperson or marketer brings in.
- Customer Retention per Support Agent – How many customers a support agent helps keep satisfied.
- Feature Releases per Developer – How many impactful features a developer ships over a period.
So, while Revenue per Employee is a great overall indicator, businesses often track individual performance metrics to see who contributes the most and how they can improve productivity.
Final Thoughts about Business Metrics – Turning Data into Business Success
Understanding and tracking these key business metrics can make a huge difference for even small and medium-sized businesses. They help owners and decision-makers
- optimize operations,
- improve profitability,
- manage costs, and
- plan for growth.
Whether it’s monitoring revenue, reducing churn, or improving employee productivity, these insights provide a clear roadmap for smarter decision-making.
The best part? You don’t need to be a financial expert to use these metrics effectively. With the right approach, even small businesses can leverage data to streamline processes, increase customer retention, and boost profitability. By consistently tracking and improving these numbers, businesses can stay competitive.